Quevedo Datasets
Note
If you have cloned Quevedo, you can find an example dataset in the folder
examples/toy_arithmetic. Playing with this dataset might make the
explanations below more understandable.
Quevedo datasets consist of source images, annotations on those images, and other metadata that can help with their interpretation. While it can be used for less complex images, Quevedo's focus is on images with compositional meaning, such as constitute visual languages, like UML, or complex writing systems, like SignWriting or musical notation.
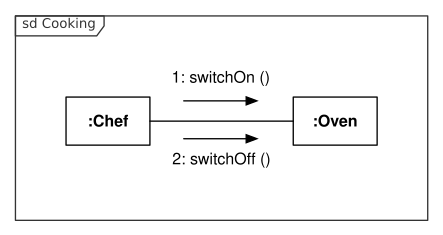
Example of an UML communication diagram (source: Oemmler @ Wikipedia)
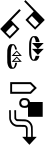
Example of a SignWriting transcription representing the ASL sign for "SignWriting" (source: Slevinski @ Wikipedia)
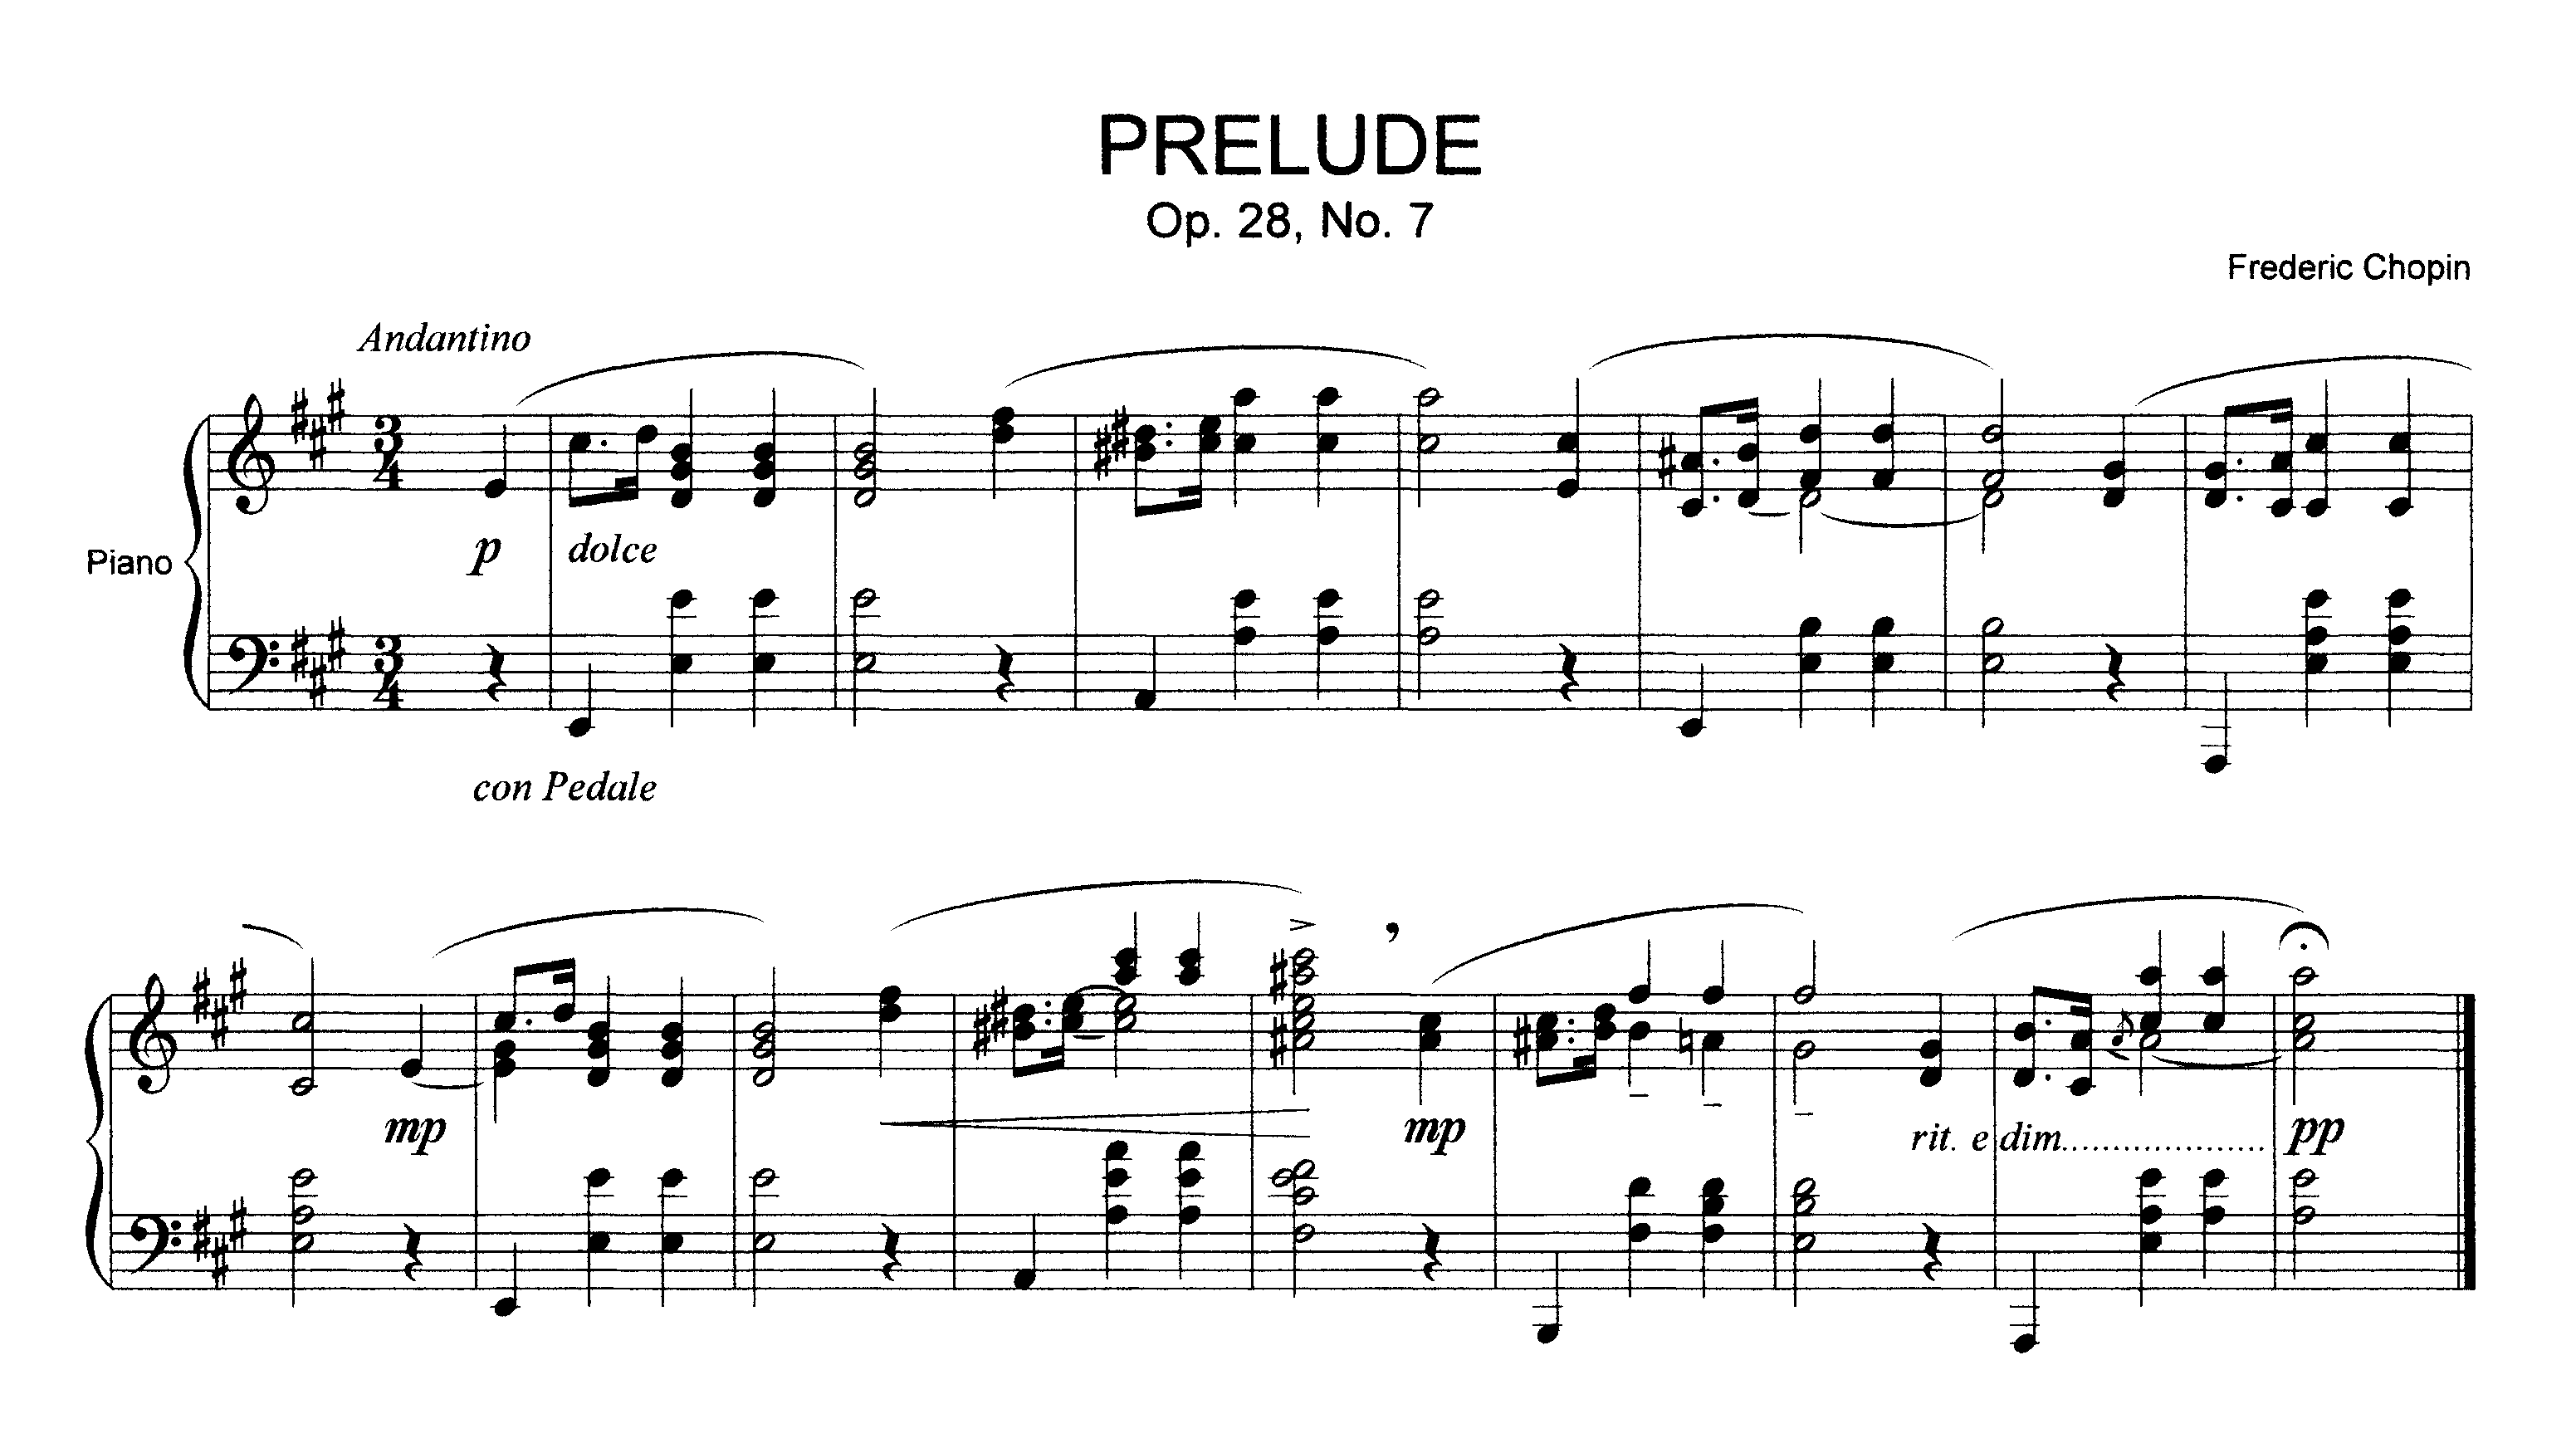 An example of modern musical notation: Prelude, Op. 28, No. 7, by Frédéric Chopin
(source: Prof.rick @ Wikipedia)
An example of modern musical notation: Prelude, Op. 28, No. 7, by Frédéric Chopin
(source: Prof.rick @ Wikipedia)
Logograms and Graphemes
Quevedo recognises two types of source images: logograms and graphemes. Graphemes are atomic, individual symbols that represent some particular meaning in the target visual language, while logograms are images made up of graphemes in complex and meaningful spatial arrangements. In the UML example above, the different boxes, arrows and characters are graphemes. In the SignWriting example, the hand symbols along with the arrows indicating movement are the graphemes. In the sheet music excerpt, one can identify the notes, accidentals and other symbols as graphemes. As for logograms, what constitutes a logogram depends on the target language and the goal of the researcher, but to Quevedo, any logogram is an image file where graphemes are arranged according to some underlying meaning.
The names logogram and grapheme come from the original problem for which Quevedo has been designed, which is automatic recognition of visual languages, but the software imposes little meaning to the terms beyond the fact that graphemes are independent and atomic, and logograms are composed of spatially arranged graphemes. Therefore, Quevedo can be used to manage datasets for problems of varying complexity, as long as the source data are images with some compositional structure.
Annotation of logograms and graphemes
One of the characteristics of visual writing systems is that they can encode multiple meanings within a single symbol, taking advantage of the possibilities offered by the visual medium. In Quevedo, annotation consist not of a single tag, but rather of a dictionary of tag names and values. This allows different systems to use different aspects of the symbols' meaning, and also lets researchers experiment with different, simultaneous and possibly overlapping annotation schemas for the dataset.
Each annotation, both logograms and graphemes, has one such dictionary of tags associated, manually entered by an annotator or automatically filled by some process. Logograms, additionally, have a list of graphemes found within them, and each of these also has a dictionary of tags. Independent annotations (so, not the graphemes within logograms) can also have "meta" tags which can be used to represent other information, such as source of the annotation, status, notes, etc.
To represent the spatial relations between graphemes, logograms also contain a graph of edges between the graphemes. These edges again have their own annotation schema and dictionary of tags.
New in v.3
Logogram graphs are new in version 1.3.
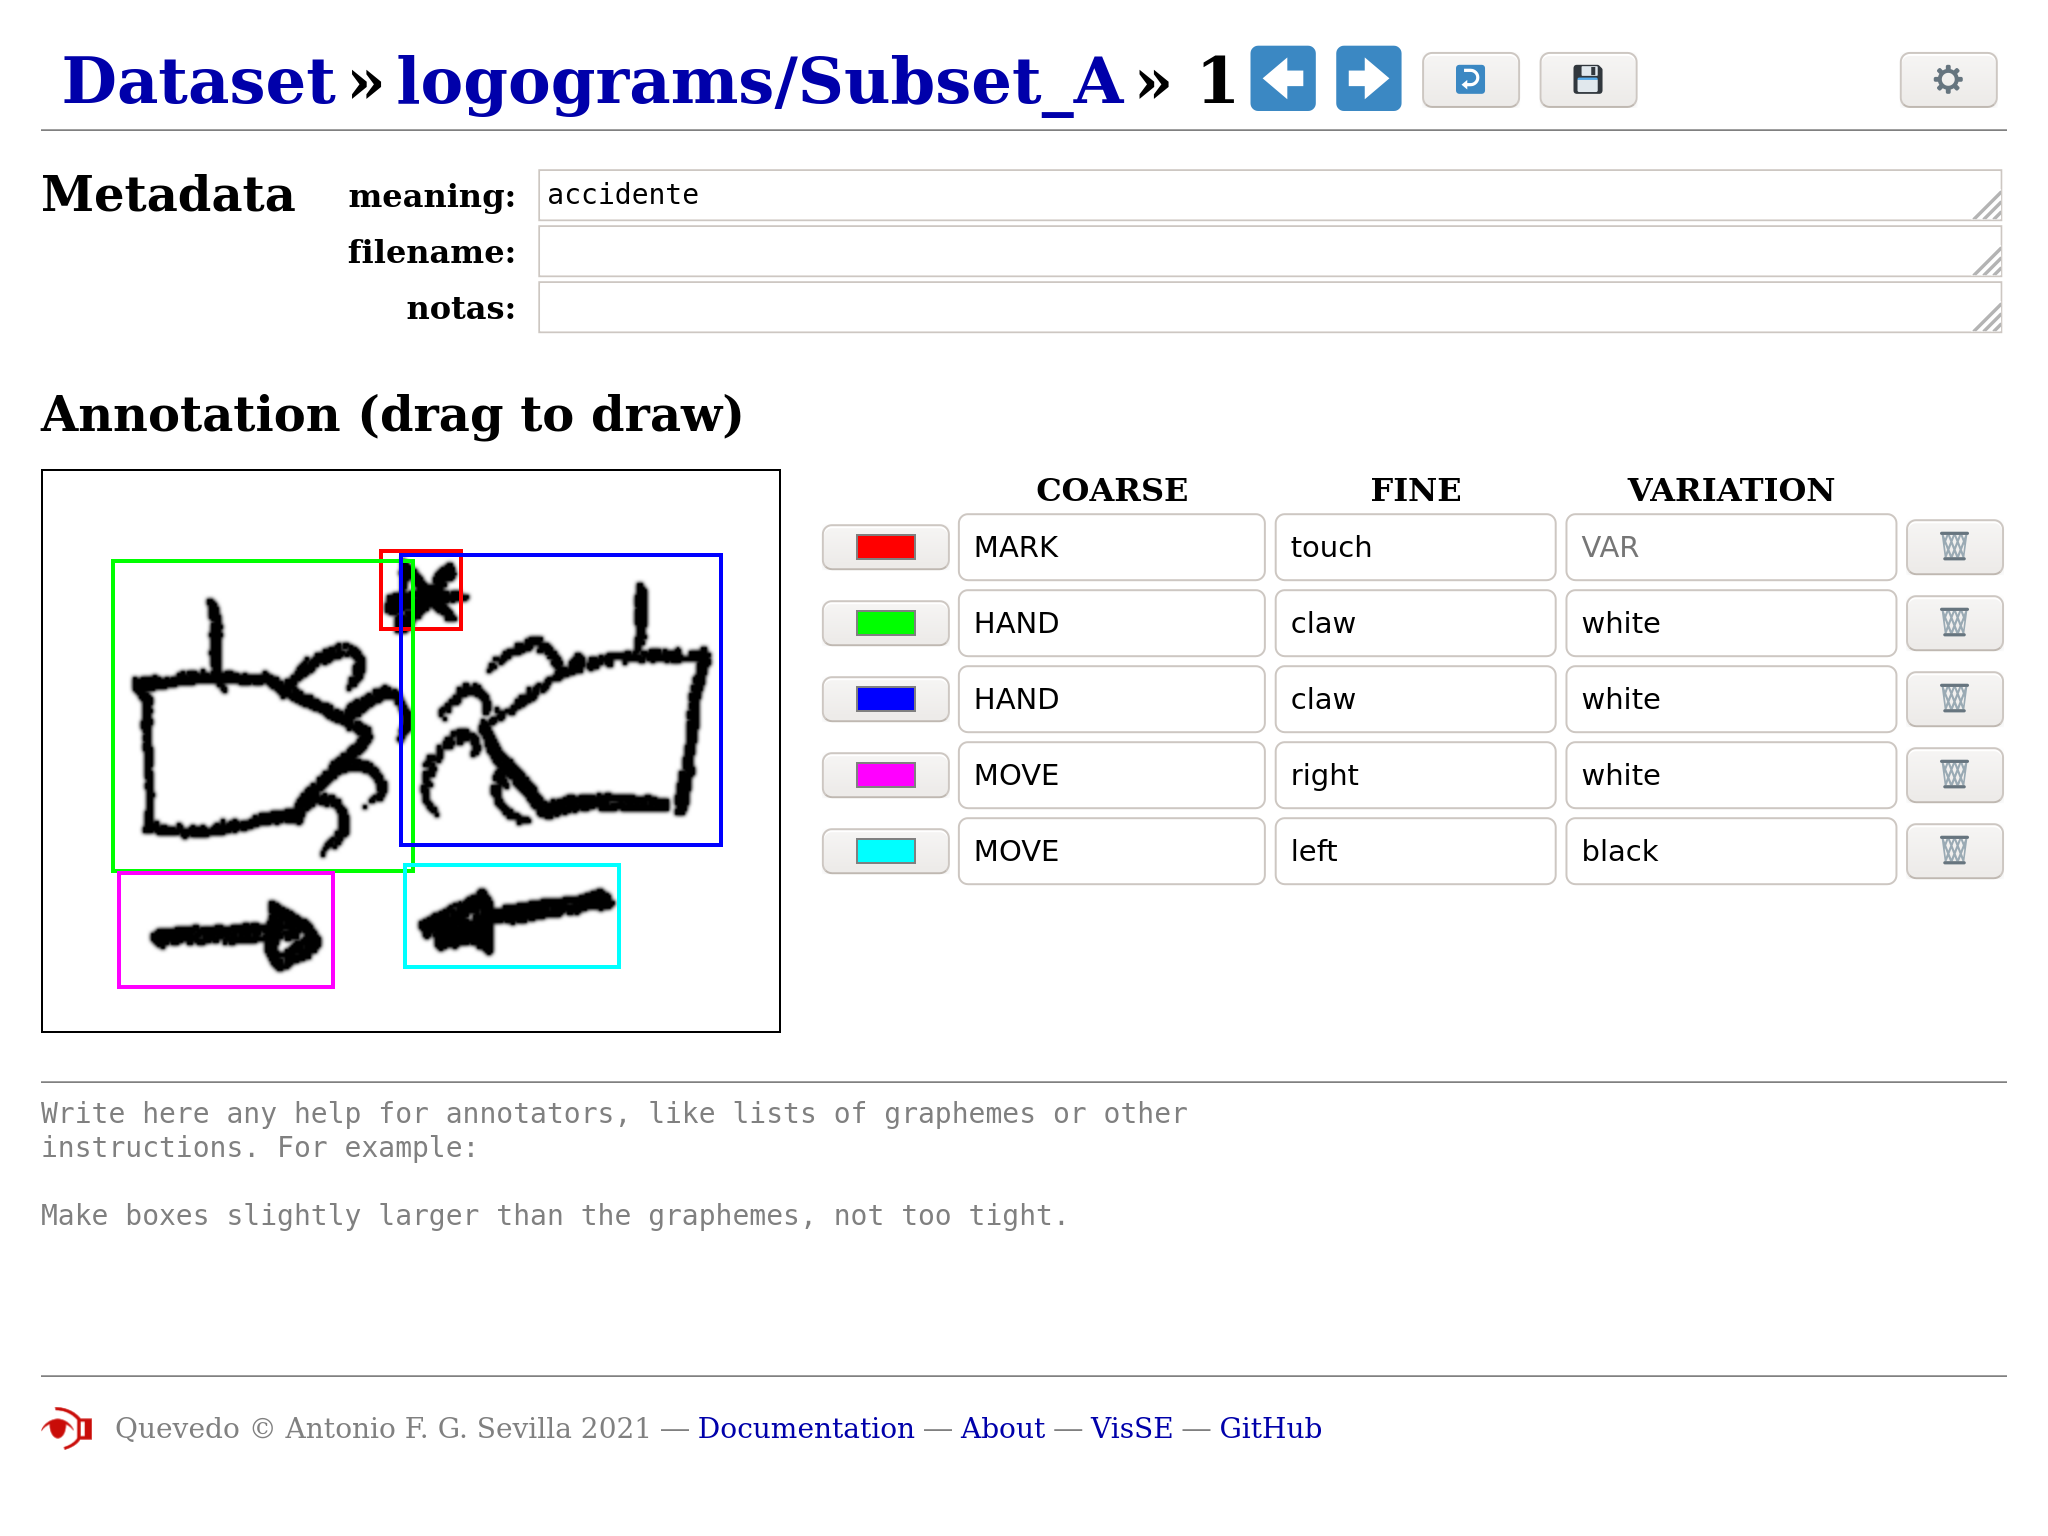
Example of the annotation of a logogram in the web interface
Dataset structure
Each Quevedo dataset is a directory on disk, containing a configuration
file named config.toml, and a number of directories. Files which
Quevedo doesn't recognize will be ignored, so it is safe to add these files that
other programs (such as git or DVC) may need.
Annotations are stored in subdirectories of the logograms and graphemes
directories (depending on their type). Each subdirectory represents a data
subset, which can be used to perform different experiments on different sets, or
just to organize data in some meaningful way.
Annotations in each subset consist of two files: <number>.png and
<number>.json. The .png file is the source image, in PNG format, and the
.json file contains the annotations in JSON format. These are standard
formats, so annotations in a Quevedo dataset can be read and modified by
external tools and inspected by humans. The annotations are sequentially
numbered, so corresponding images and json files are easily found.
There are two additional directories which Quevedo uses: networks and
scripts. In the networks directory, the training configuration and weight
files for each different neural network are
stored. Each network has a name, and its files are all organized in the
subdirectory of networks with the network name.
The scripts directory can contain useful scripts for additional management of
the dataset. For example, a researcher can store the .r scripts used to
evaluate different metrics on the dataset, or shell scripts to process images or
extract annotation information. A special case are python files (ending in
.py) which Quevedo can understand.
dataset_root
├─ config.toml
├─ logograms
│  ├─ subset_1
│  │  ├─ 1.png
│  │  ├─ 1.json
│  │  ├─ 2.png
│  │  ├─ 2.json
│  │  └─ ...
│  └─ other_subset
├─ graphemes
│  ├─ subset_1
│  │  ├─ 1.png
│  │  ├─ 1.json
│  │  └─ ...
│  └─ other_subset
├─ networks
│  ├─ network_1
│  │  ├─ train
│  │  ├─ darknet.cfg
│  │  ├─ darknet_final.weights
│  │  ├─ results.json
│  │  └─ ...
│  └─ network_2
└─ scripts
Example of a Quevedo dataset directory structure
Interaction with git and DVC
Since Quevedo datasets are directories on disk, and the different files use standard formats, Quevedo datasets can interact nicely with other tools, such as git and DVC. In particular, a Quevedo dataset can also be a git repository, and therefore a DVC repository too. This can help with dataset sharing and experiment reproducibility. We recommend using git to track configuration files and scripts, and DVC to track source data, annotations, and experiments.